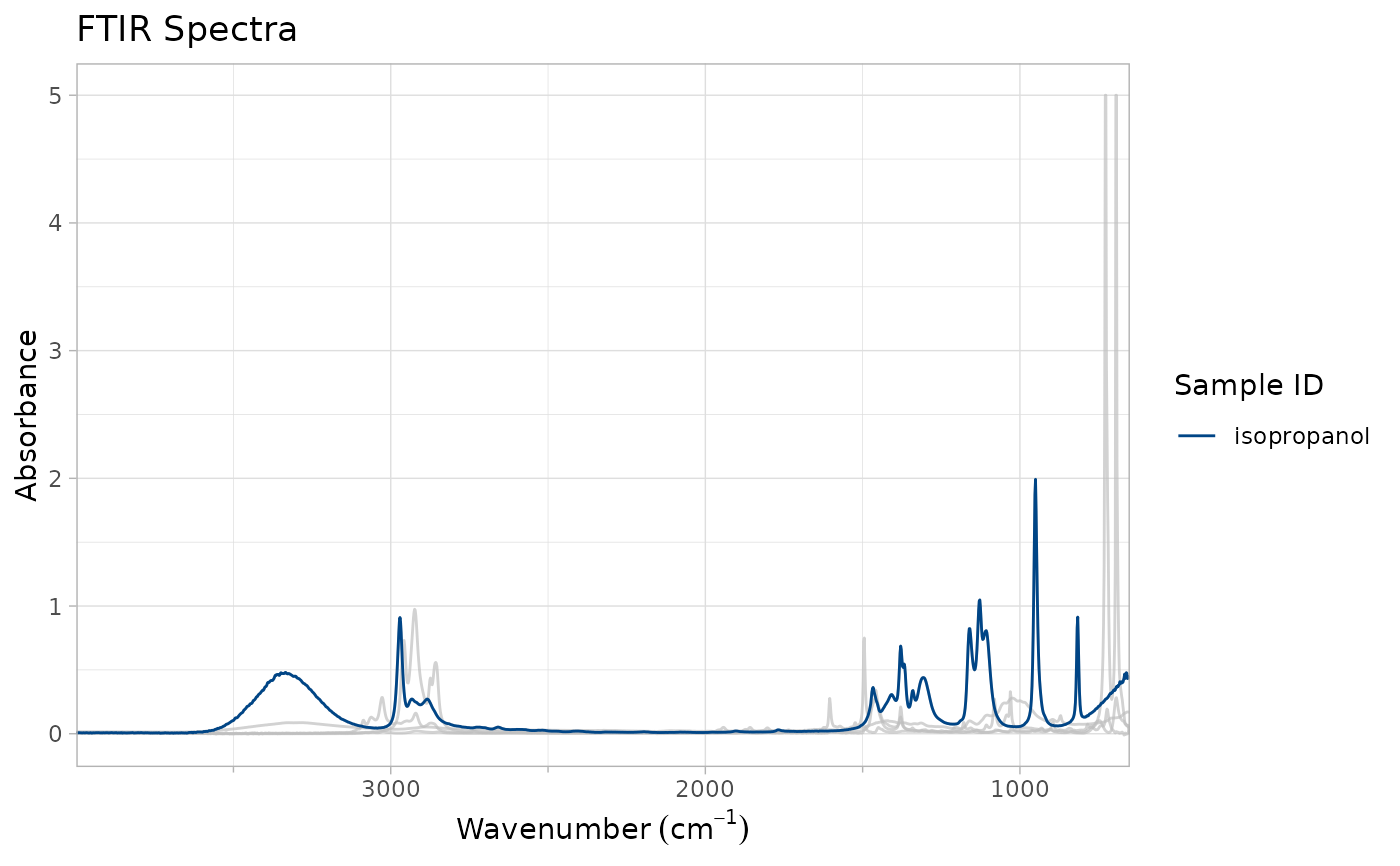
Highlight one or more sample spectra on a spectral image. Changes all un-selected sample_ids to grey lines. Requires gghighlight::gghighlight() to function.
Surligne un ou plusieurs spectres d'échantillons sur une image spectrale. Change tous les spectres sample_ids non sélectionnés en lignes grises. Nécessite gghighlight::gghighlight() pour fonctionner.
Arguments
- ftir_spectra_plot
A plot generated by [plot_ftir()] or [plot_ftir_stacked()]. Un tracé généré par [plot_ftir()] ou [plot_ftir_stacked()].
- sample_ids
A vector of one or more
sample_ids from theftir_spectra_plotto highlight.Un vecteur d'un ou plusieurs
sample_ids duftir_spectra_plotà souligner.- ...
Additional parameters to pass to
gghighlight::gghighlight().Paramètres supplémentaires à passer à
gghighlight::gghighlight().
Value
the FTIR plot as a ggplot2 object, with selected sample spectra highlighted.
le tracé FTIR en tant qu'objet ggplot2, avec les spectres de l'échantillon sélectionné soulignier.
Examples
if (requireNamespace("ggplot2", quietly = TRUE) & requireNamespace("gghighlight", quietly = TRUE)) {
  # Generate a plot
  p <- plot_ftir(sample_spectra)

  # Highlight one sample:
  highlight_sample(p, "isopropanol")
}